

Poison Trees - 315 Chapel Street Keysborough - Extract from client report #4
Executive Summary
The following report detailed has been prepared post site inspection/ preparation/PHC Works and Photosynthetic analysis of the trees by Matthew Daniel since May 10 2017. 4 x visits have been conducted to date to gather a significant amount of plant function data detailed throughout this report. Additionally, soil health liquid treatments have been applied (Total to date 18000 L to arrest the mode of action of herbicide and stimulate the selected trees to arrest rapid decline. At this stage, the photosynthetic data suggest some trees still have the capacity to regenerate even though visually the herbicide is causing significant desiccation (Browning off) The data interpretation suggests trees 1,2 and 3 have stabilized in contradiction to the Visual Tree Assessment. Trees 4, 5 and 6 have reduced photosynthetic function and may be in the process of dying.
Site Summary
There are 10 x Remnant Red Gums onsite that appear to be poisoned. The visual pattern is consistent with herbicide application. No signs of drill hole in the cambium where present and or in buttress or structural roots. The client had been instructed to remove the grass sod from the base of the structural root zone which is an appropriate method in this instance, although it made it difficult for Matthew to investigate and determine the method of poisoning event. On the 10th of May 2017 Matthew attended the site and met with property owners. Between 9:00 am and 1:30pm Matthew conducted a visual analysis of the individual trees, and collected initial physical soil measurements. 6 -7 of the 10 trees poisoned where determined to potentially have adequate active vascular cambium activity and photosynthetic functional capacity to arrest the rapid decline. All ten trees have advanced desiccated foliage
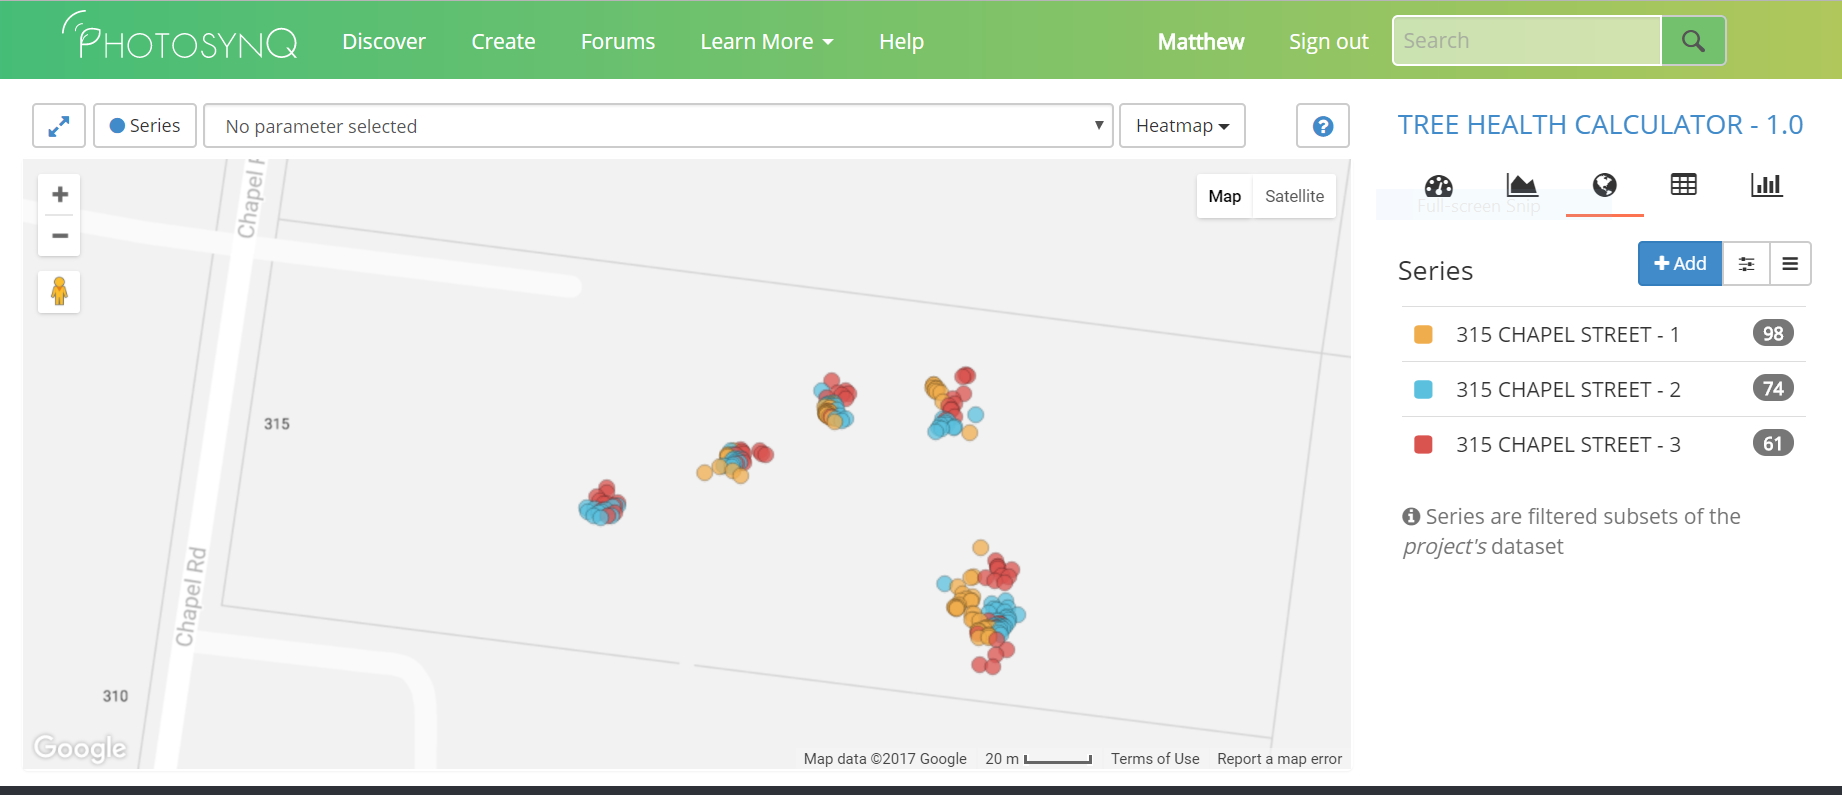
Tree Health Calculator Dashboard - Raw Data

Summary of results to date - 315 Chapel Street
Based on the details of a preliminary viewing of the data, it has been determined that the best approach to the data analysis was to analyze tree’s 1-3 and tree’s 4-6 separately.
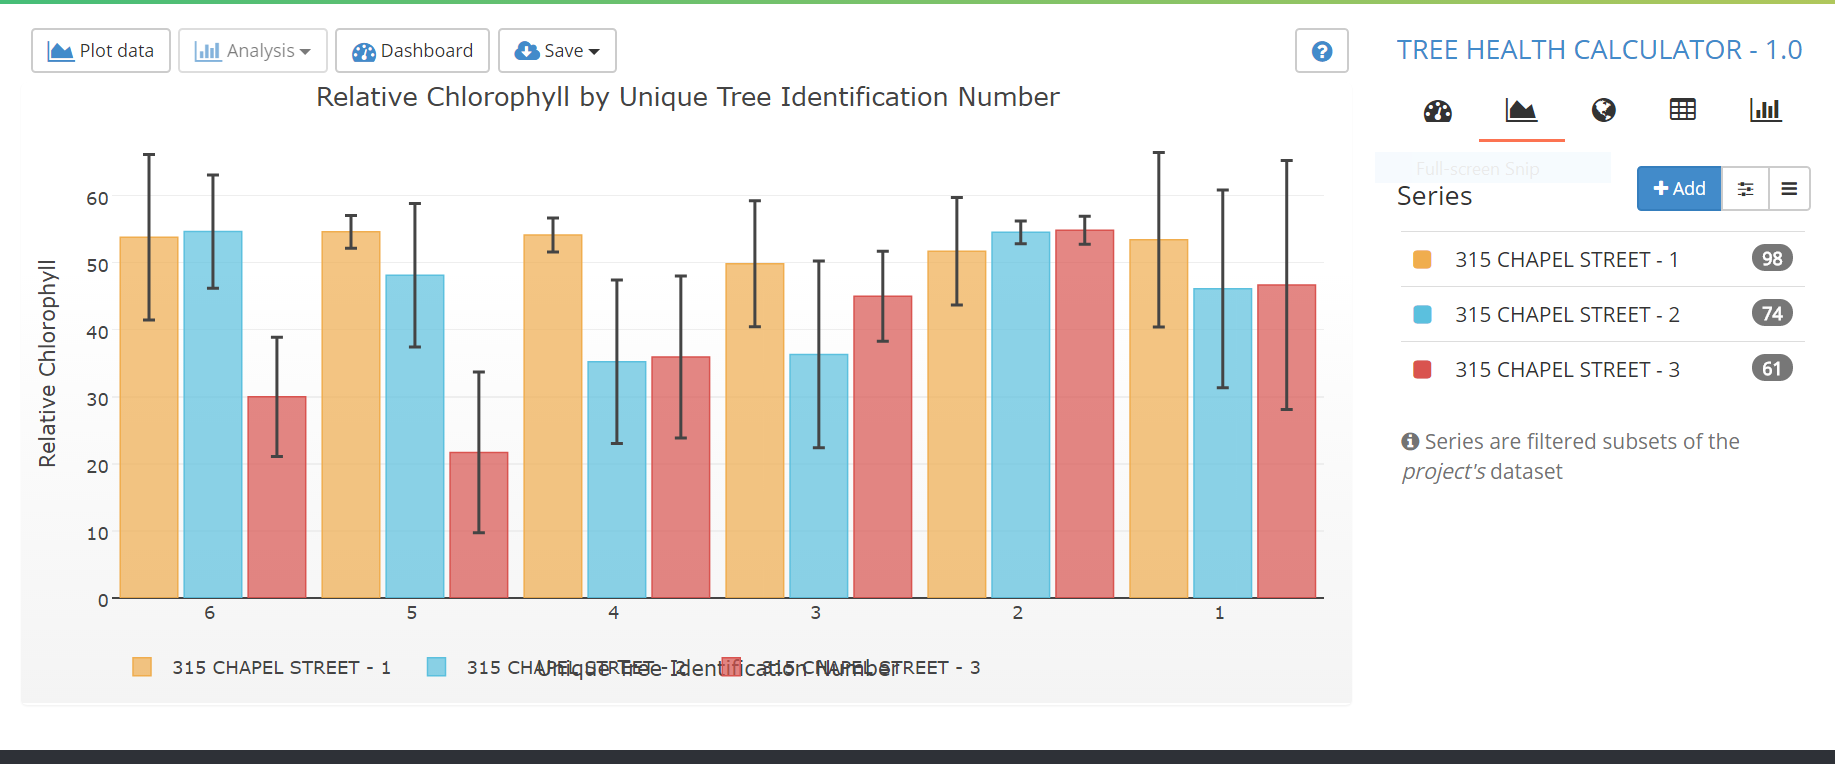
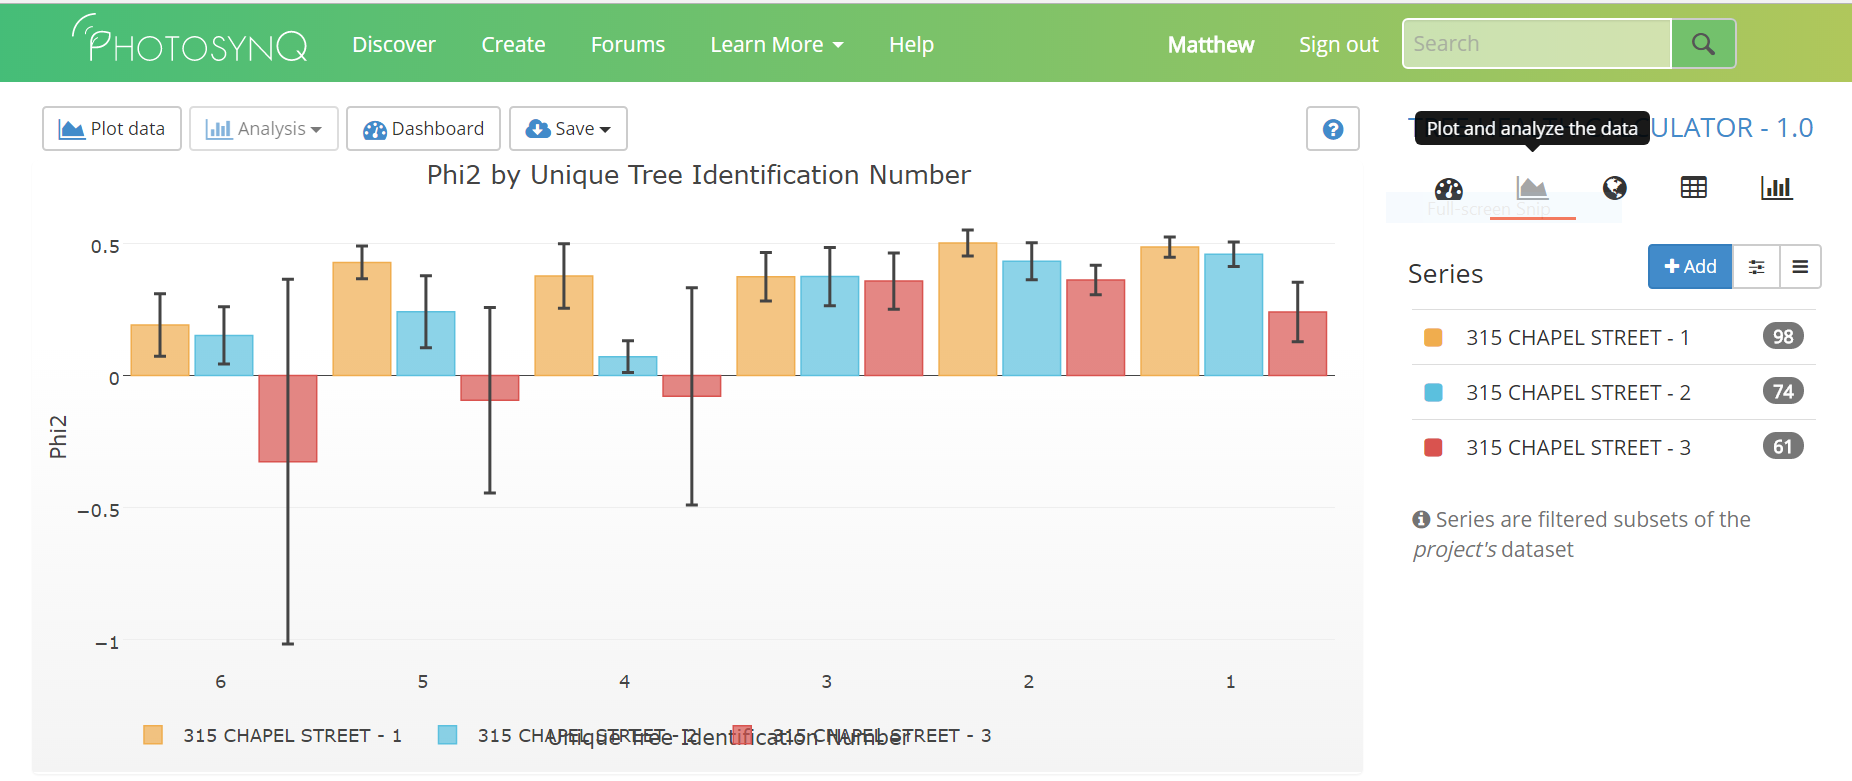
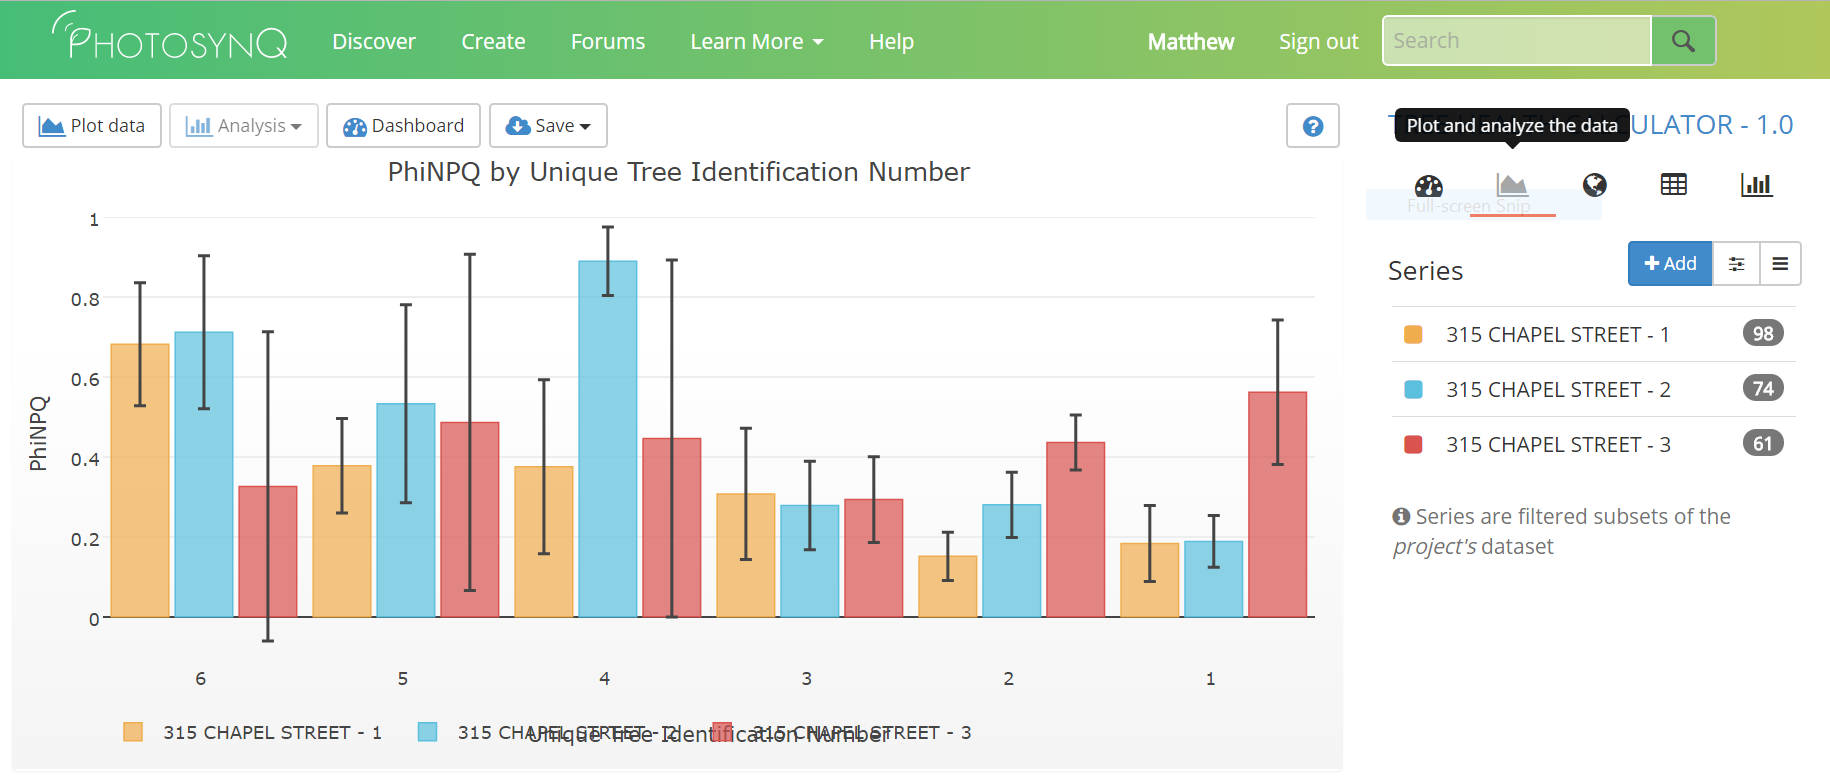
Health of tree’s 1, 2 and 3: From the 1st sampling date on May 12 until July 7, the relative chlorophyll content (Fig. 1) and efficiency of photosystem II (Phi2) (Fig. 2) decreased while PhiNO (the ratio of energy lost to unregulated processes) increased. These results suggest a general decline in tree health. However, while not statistically significant, from July 7 until July 31, there appeared to be a slight recovery in relative chlorophyll content and Phi2. Also during that period, the trees regulation of photosynthesis to shed excess light (PhiNPQ) increased and PhiNO decreased, suggesting a recovery of the tree’s ability to regulate photosynthesis.
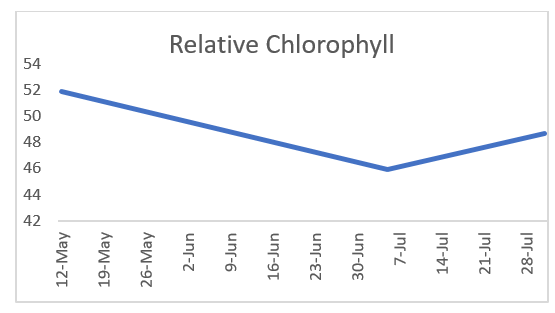
Figure 1. The relative chlorophyll content of tree’s 1, 2, and 3 from May 12 until July 31.
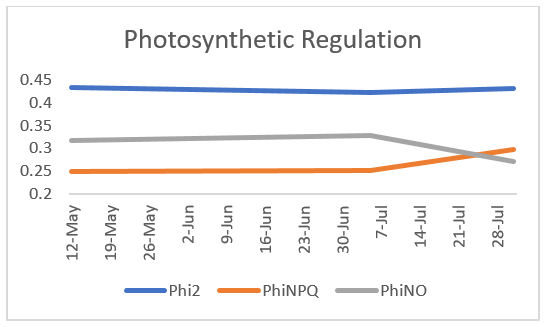 Figure 2. The ability of tree’s 1, 2, and 3 to regulate photosynthesis from May 12 until July 31.
Health of tree’s 4, 5, and 6. After examining the raw data from tree’s 4, 5 and 6 it became apparent that multivariate analysis was inappropriate for these trees. Instead, it was clear that many of the measured leaves were unable to undergo chlorophyll fluorescence at all, suggesting that they were not undergoing photosynthesis. This trend was increasing over time. On May 12, 97% of measured leaves were undergoing photosynthesis, but by July 31 that number had dropped to only 7% (Fig. 3). It is clear from this data that a majority of leaves on tree’s 4, 5, and 6 were senescing.
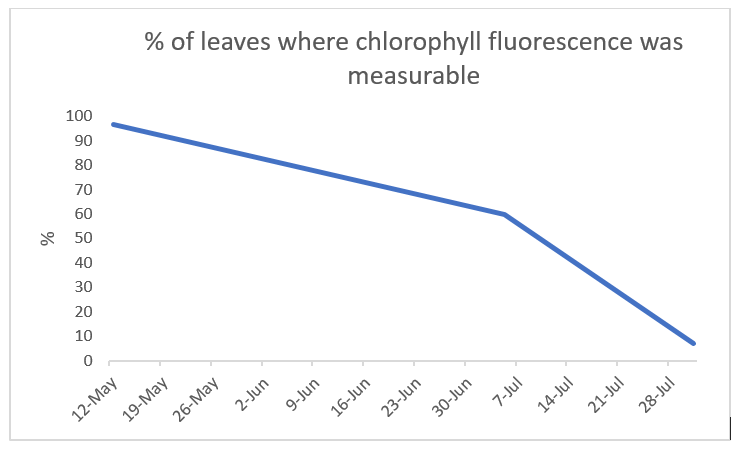 Figure 3. The percentage of measured leaves on tree’s 4, 5, and 6 that had measurable chlorophyll fluorescence.
Conclusions: Tree’s 1, 2 and 3 appear to have begun to recover, if only slightly, while tree’s 4, 5 and 6 seem to be senescing. It is recommended collecting measurements on tree’s 1, 2 and 3 again to confirm tree recovery.