


Adelaide City - Veal Gardens - Plant Health Care Program
Introduction and Methods
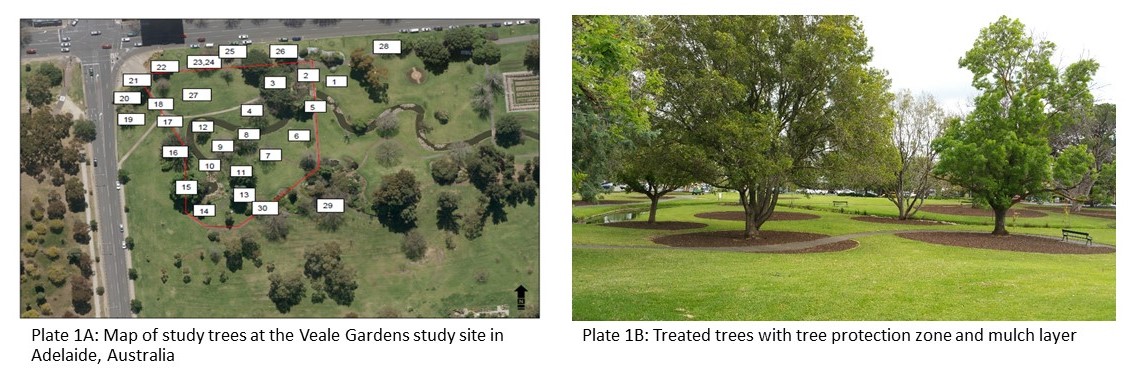
The historic Veale Gardens, part of the Adelaide Parklands surrounding the city, has been in a state of severe decline for a decade. A substantial amount of tree mortality has occurred over many years leading to a major loss of canopy cover throughout the park.The north-eastern corner of the gardens was identified as a key area of tree decline and Tree Preservation Australia was commissioned to determine the cause and identify a rehabilitation program to save the trees including a number of significant species.
Tree Preservation Australia conducted a detailed assessment of tree decline and collected a considerable amount soil sampling and plant and soil function measures on 30 trees in the most affected areas.
Baseline plant and soil measurements and visual assessments were used to determine a Plant Health Care (PHC) program based on scientific validation to address the issues and restore tree and soil health. This data collection included:
- Soil Chemistry
- Soil Biology
- Soil CO2 respiration
- Soil Moisture
- Soil compaction
- Photosynthetic function
- Visual tree health assessments (poor, fair, good)
Plant Health Care Programs: Tree protection zones (TPZ) were calculated and mulch beds negotiated.
- Turf (Grass) was carefully removed within the TPZ
- A biologically tested compost applied at 150mm
- A mulch material applied at 200mm
The 350mm thick root zone material was then inoculated with microscope qualitative assessed microbial concentrate of
- Actively Aerated Compost Tea (AACT)
- Microbial stimulants
The mulch material rapidly decomposed over a two-month intensive liquid PHC application period. The microbial activity went through multiple microbial flushes from bacterial bloom – Slime mold (Fuligo septica) – Saprophytic species (Mushrooms). The material decomposed to about 100 mm and became a mycelium blanket over the root zone.
Data Collection
During a 3-month period following treatment, MultispeQ photosynthesis data was collected to track tree health and compared to visual tree assessments taken at the same time. For each tree, 20 MultispeQ measurements were taken from random positions with in the tree canopy.
The purpose of this summary is to show preliminary validation of the ability of MultispeQ parameters to distinguish between tree’s of different health conditions and to provide proof-of-concept data supporting the use of the MultispeQ to diagnose tree health. As such, the two primary objectives of this analysis are to determine:
- Which MultispeQ measurements, if any, correspond to visual tree health assessments?
- If the MultispeQ can be used to develop a sensor based tree health calculator to diagnose tree health?
Do MultispeQ measurements correspond to visual tree health assessments?
The first goal of this analysis was to determine which, if any, MultispeQ parameters have potential to serve as early indicators of tree stress. In order to accomplish this goal, we compared tree’s that were visually assessed to be of poor health to trees that were assessed to have either fair or good health for each sampling date. Multivariate analysis was used to account for light intensity and time of measurement, both of which can affect photosynthesis measurements.
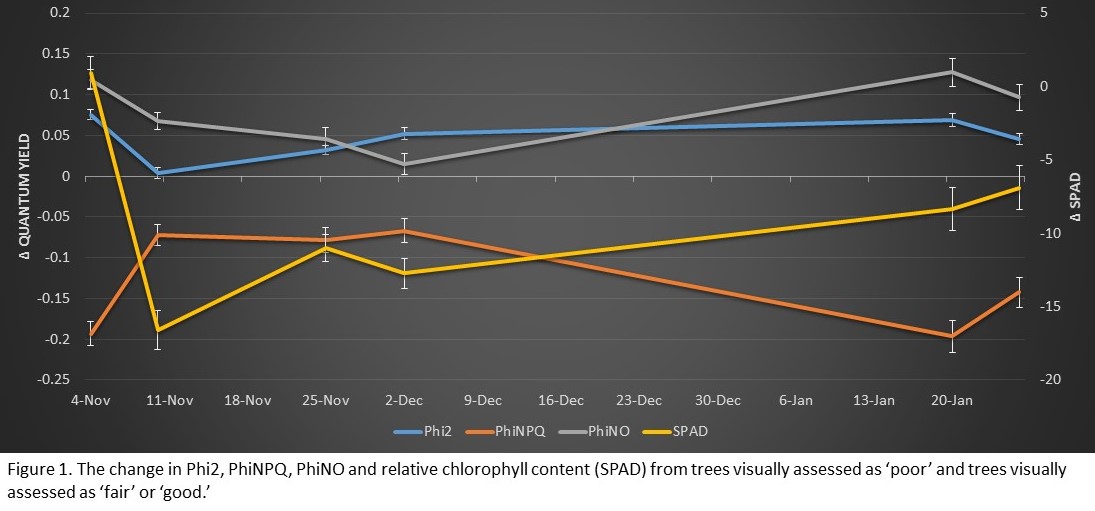
The difference between fair or good trees and poor trees are shown in Figure 1. The quantum yields of photosystem II (Phi2) and other energy losses (PhiNO) were significantly increased in fair/good trees at every sampling date except for November 10 (Phi2) and December 2 (PhiNO) (p < 0.05). Conversely, the quantum yield of nonphotochemical quenching (PhiNPQ) was significantly reduced in fair/good trees at every sampling date. Relative chlorophyll content was not significantly changed between fair/good and poor trees on November 4 and 10, but was significantly reduced in fair/good trees every sampling date starting November 25.
These results suggest that healthier trees (i.e. tree’s visually assessed as fair or good) were actively regulating away less energy from photosynthesis (PhiNPQ) than trees of poor health, increasing the photosynthetic efficiency of these trees (Phi2).
Can the MultispeQ be used to develop a sensor based tree health calculator to diagnose tree health?
Having successfully validated that MultispeQ measurements relate to visual tree assessments, the long-term goal is to develop a real-time tree health calculator to diagnose tree health status using objective, MultispeQ based data. In the absence of a large dataset of MultispeQ tree health data, this can only be accomplished by comparing unknown test trees to known reference trees that are measured under the same light intensity, temperature, growth stage and tree age conditions as the test trees.
In this study, we identified four trees that failed to respond to the PHC program and were assessed as poor for the duration of the study; we used these trees as a lower tree health baseline. Additionally, we identified five trees that were in good health prior to the establishment of this study and used these trees as an upper baseline for tree health at the study site. We then compared these baseline trees to other trees in the study area. Again, we use multivariate analysis to account for light intensity and time of measurement.
The change in each MultispeQ parameter over time for each category of tree, upper baseline, lower baseline, and test trees are shown in Figure 2. The relative chlorophyll content of the upper baseline trees was significantly lower than the lower baseline and test trees at all but the first sampling date (Fig. 2A), while the lower baseline and test trees had significantly different SPAD at all but the 1st and last sampling dates (p < 0.05). The separation in Phi2 between the test trees and the upper and lower baseline trees were generally very small (Fig 2B). On the other hand, the test trees tended to have significantly lower PhiNPQ than the lower baseline and significantly higher PhiNPQ than the upper baseline (Fig 2C). The opposite was true for PhiNO, where the lower baseline was below the test trees and the upper baseline was above the test trees (Fig 2D).
SPAD, PhiNPQ and PhiNO all appear to be potentially useful indicators to diagnose tree health status. Furthermore, these preliminary results support our belief that the MultispeQ can be a useful tool in developing real-time, sensor based tools to diagnose tree health.

Coburg Lake Reserve Analysis
Analysis documents + R scripts: https://drive.google.com/open?id=0ByqRYMgnYFjBNWFoM1FaYndjbE0
Data for graphs: https://drive.google.com/open?id=0ByqRYMgnYFjBQVNweGZHUEVjTjA
First pass analysis (website):
I created series only from data with COBURG LAKE RESERVE in the TPA Site Number, and then using 1/tree1,2,3,4/4 control,5,6,7 to get the series for trees 1 - 7 .
A decent amount of data cleaning was done to address bad data points not originally caught. A lot of data had low batteries, but not so low that it was worth eliminating it. Overall, the data quality was not great, but consistent enough and good enought to use.
Looking at the raw data using the data explorer, there are clear differences between the 7 trees in terms of PhiNO and PhiNPQ, with the most noticeable difference between tree 1 and tree 5 (see graphs below).
Tree 1 has higher PhiNO, a less straight PhiNO / PhiNPQ relationship (possibly indicating that it’s energetically out of balance), and a higher Phi2 (strangely, but true). 1 also has 60 uE lower PAR, which would normally produce lower Phi2 and higher PhiNPQ… but given that it does the opposite that does indicate a clear real difference between the plants.

(interesting side note: in the upper right graph (PhiNPQ vs. Phi2) you see the small band of data points which sit above the majority of points? Those are the data points collected at 2am. You can clearly see that the plant dark adapted to such a point that the entire phi2/phiNPQ curve has shifted up so as to absorb the maximum amount of potential light. This is expected in theory but cool to see :)
Anyway - In fact, there was much more variation in PAR from the other trees, specifically trees 2 and 4.

If you run ANOVA to test for differences in PAR - they are definitely significant -

That means that any other simple ANOVA comparisons between the trees becomes somewhat invalid because PAR drives most of the changes in photosynthesis… therefore differences in Phi2, PhiNO, PhiNPQ etc can be caused by changes in PAR, not other things.
Running statistics
So that leaves statistics :) If you run a regression on the raw data to correlate photosynthetic params + other visual etc. paramers to the visual tree condition variable, the photosynthesis variables don’t tell you anything significant (though compaction seems quite important):

I realized, after looking at the tree health indicator (good, fair, poor) and amount of variation across the 7 trees, this wasn’t very useful… tree health didn’t change much for the 7 trees so trying to predict tree health based on the photosynthetic parameters (which is usually the most interesting and fruitful thing to do) wasn’t going to do much for us.
So, the next best thing is to simply see if there are significant differences between the populations… Since there are known differences in PAR between the 3 trees, we can’t just use raw averages (because they’ll be biased by the PAR differences). So we need to account for PAR and anything else. So to normalize for par, time or day, canopy location, and date, we run a set of regressions which look like this:
photosynthesis_variable -> parSqrt + (1|morningAfternoon) + (1|Canopy.Sample.Area) + (1|dateCollapsed) + treeID")
Where photosynthesis_variable is Phi2, PhiNO, PhiNPQ or SPAD and parSqrt is the square root of PAR light intensity values (for best fit), and dateCollapsed is a combination of data collection days to ensure that each tree was measured at least once (so that the model works).
From this, we can use the treeID coefficients to build a new set of ‘normalized’ averages for each photosynthesis parameter, by tree. This produced fruitful and significant differences. Here, tree 1 is always == 0 (so if anything is significantly different than 0, it’s significantly different than tree 1).

Again, Tree 1 is clearly the lowest PhiNPQ and highest Phi2 tree of the bunch, with tree 2 running close behind. Low PhiNPQ and high Phi2 (in general) relate to improved plant health. There are some differences between the other trees, but most are not significant (significant differences are > ~ .03). While this doesn’t correlate to any actual visual scoring or yield data, it does produce some believable, significantly different results.
Conclusions
Based on the above data, both visual raw data and the final post-normalized regression data, it’s clear that tree 1 and 2 have lower average PhiNPQ, higher average Phi2, and higher average SPAD than the other trees, especially tree 5. In general, this would suggest that tree 1 is ‘healthier’. There is not sufficient additional data to determine the cause. Other data also shows an improvement in soil compaction during that period (possibly due to the soil amendments?). Unfortunately, there wasn’t robust enough scoring or yield data to correlate to a more independent set of outcomes for a stronger connection to an apparent significant difference between trees 1/2 and the rest of the trees.