

Ambient PAR validation
This project is to validate the ambient PAR (Photosynthetically Active Radiation) measurement as part of the MultispeQ v1.0, using the initial 20 devices shipped from the factory in Nov 2016.
Summary
- The MultispeQ ambient PAR correlates well to a LiCOR LI-250A PAR meter (LiCOR = MultispeQ * 0.95 + 3.99, r2 = .996, using 13 devices with 206 total measurements). Devices showed some offsets from the actual PAR, but the noise at any given light level for each device is relatively low (high r2).
- Validation included measurements in different spectral conditions: cloudy day, sunny day, LED, and fluorescent lights.
- Additional spectral conditions (for example, inside a dense canopy) should be added to improve the quality of the validation.
Background
Photosynthetically Active Radiation (abbreviated as PAR) is the portion of light which can be used for photosynthesis by plants or algae (see wiki for details https://en.wikipedia.org/wiki/Photosynthetically_active_radiation). The range of PAR is 400 - 700nm range (blue to deep red), with more energy (or photons) absorbed depending on the wavelength. The graph below shows the absorption curve for PAR (referred to as photon flux).

Most light sensors do not absorb at the exact wavelengths and intensities to match PAR as seen above. Therefore, PAR meters need to do some combination of light filtering (to remove < 400nm and > 700nm) and/or software correction to mimic the PAR curve.
The MultispeQ has an optical filter (cut-off filter at 700nm) as well as software calibration to match this curve. The MultispeQ calibration measures light response in various simulated light conditions (cloudy day, under canopy, sunny day, fluorescent lights, LEDs), and uses multiple linear regression with the R, G, and B components of the incoming light as dependent variables to correlate to an industry standard meter. There are many commercially available PAR meters, but we chose the LiCOR LI-250A as our industry standard comparison.
 Light calibration box with simulated light conditions, calibrating a MultispeQ
Results
After calibrating 13 devices using the 2c - v1.0 FACTORY CALIBRATION project, the devices were placed in 3 light conditions and compared against a LiCOR PAR meter. These light conditions were: 1) cloudy day, 2) fluorescent lights (growth chamber), and 3) White LED. If the filter and software calibrations were successful in mimicking a LI-250A PAR sensor, all those conditions should produce a consistent, linear fit with minimum variation between devices.
The results (graph and fit) for all devices and all light conditions is shown below.
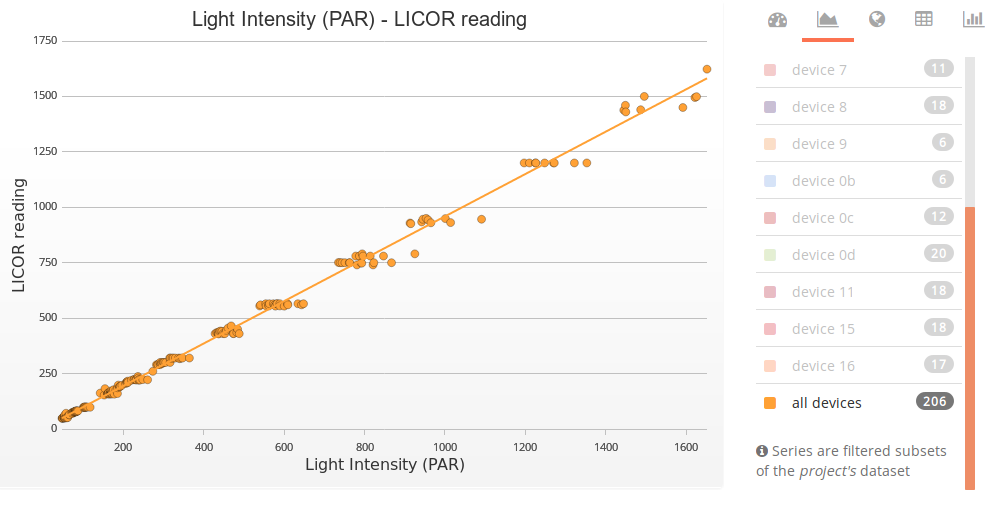
- all devices :: y = 0.95x + 3.99 (r2 0.996)
Now, by light conditions (cloudy, not cloudy, fluorescent, LED):

- Outdoor No Shade :: y = 0.49x + 732.78 (r2 0.494)
- LED :: y = 0.94x + 23.44 (r2 0.984)
- Fluorescent lights :: y = 0.94x + 3.44 (r2 0.996)
- Outdoor Cloudy :: y = 0.75x + 18.37 (r2 0.88)
The poor fit from "outdoor no shade" is due to the limited PAR range and number of samples, but in fact the fit is consistent with the trend.
Now, the fit quality across all 13 devices to determine how much variation there is between devices:

- device 1 :: y = 1x + 2.09 (r2 0.999)
- device 2 :: y = 1x + 6.59 (r2 0.999)
- device 5 :: y = 0.91x + 4.88 (r2 0.999)
- device 6 :: y = 0.95x + 9.75 (r2 0.998)
- device 7 :: y = 1.01x + -2.4 (r2 0.999)
- device 8 :: y = 0.99x + -1.37 (r2 0.999)
- device 9 :: y = 0.98x + 3.01 (r2 1)
- device 0b :: y = 1.01x + -4.99 (r2 0.999)
- device 0c :: y = 1x + -14.6 (r2 0.999)
- device 0d :: y = 0.96x + -2.55 (r2 0.998)
- device 11 :: y = 0.93x + 6.72 (r2 0.999)
- device 15 :: y = 0.91x + -4.71 (r2 0.994)
- device 16 :: y = 0.99x + 0.11 (r2 1)
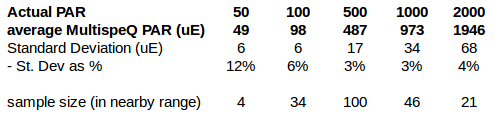
For each device, the relationship is very linear (high r2), but can be offset from the actual PAR. For comparisons between devices the standard deviation at various light intensities is shown below. A normal 95% confidence interval is 3 standard deviations.
Other sources of error
While these fits are reasonably good, they are in relatively limited ranges. While this is appropriate for some of the ranges (cloudy day, for example, is always between 25 - 200uE), for others the range should be extended. Further work will be done to extend the range for each of the light conditions.
In addition, a wider range of light conditions should be evaluated. Specifically, under a canopy (green shifted light) and incandescent lights, common among older indoor growth chambers.