
PhiNO
Measurements, Protocols & Macros

Craig Whippo
Oct 2017

My students are looking at how photosynthesis is changing over the course of fall phenology.
Junker and Ensminger show that phiNO increases as chlorophyll is lost in maple leaves. This sounds reasonable to me based on the relationship between NPQ and pmf. However, my students are getting data from the multispeQ showing that phiNO is lower in yellow leaves. I don't understand why my students are getting this result. Any ideas?
-
created
Oct 2017
- last reply
-
replies
6
-
users
4
-
-

-

-

Jonathan R Pleban
Oct 2017
I took a quick look at your data and see a decrease in phi2 in yellow leaves, which is expected. There are also absorbance/rel. chlorophyll differences in green vs yellow leaves, also expected.
To your point, the phiNO calc by standard MutlispeQ (protocal/macro) is not the same as the phiNO in Junker and Ensminger. Junker and Ensminger rely on a dark adaption period for getting dark adapted maximum fluorescence (Fm); the assumption of Fm in the multispeQ is set Fm=0.83, this might be the issue. The recent pub on phiNPQ did not test aging leaves. I hope others in the community will comment on this as it is relevant to the output of the current standard protocal. Jon
Andriy Herts, Nataliia Herts
Oct 2017
Hello. There is not everything is so simple in the "relationship" between chlorophyll and PhiNO. I think that PhiNO must and most depended with the reaction centres (qL), other pigments than only chlorophylls. SPAD don't the representation all classes of pigments.
Andriy Herts, Nataliia Herts
Oct 2017
Jonathan R Pleban: I took a quick look at your data and see a decrease in phi2 in yellow leaves, which is expected. There are also absorbance/rel. chlorophyll differences in green vs yellow leaves, also expected. To your point, the phiNO calc by standard MutlispeQ (protocal/macro) is not the same as the phiNO in Junker and Ensminger. Junker and Ensminger rely on a dark adaption period for ge...
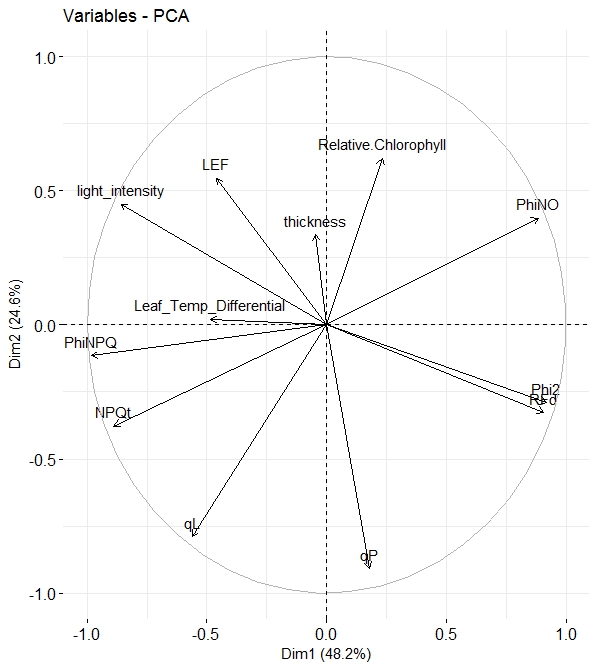
In my research (exclusively on the field is not in the laboratory), I see the positive correlation between Chlorophyll (SPAD) and PhiNO. In the laboratory research (where the light don't fluctuation) more often I see a negative correlation.
Habib-ur-Rehman Athar
Jan 2018
For drawing this graph, PCA, what type of software you used? Do you use only one factor such as varieties/leaves vs fluorescence? In my case, wheat cultivars = 4 Salt stress = 0, 60, 120, 180, 240 mM NaCl Replicates = 6 Salt stress Wheat cultivars Replicates Phi PSII FvP/FmP PhiNPQ Phi NO 1 1 1 0.3 0.67 0.2 0.03 1 1 2 0.35 0.71 0.18 0.034 1 1 3 ...... so on
Would you please suggest how can I do PCA analysis using Minitab, SPSS, OriginPro etc. Whenever I do, it is only based on one factor. The main objective is to find out which chlorophyll fluorescence attribute is associated with salt tolerance of which wheat variety. It is possible LEF, Phi PSII may contribute in one variety and Phi NPQ, NPQt contribute in other variety.
Habib-ur-Rehman Athar
Jan 2018
Andriy Herts, Nataliia Herts: In my research (exclusively on the field is not in the laboratory), I see the positive correlation between Chlorophyll (SPAD) and PhiNO. In the laboratory research (where the light don't fluctuation) more often I see a negative correlation.
Please explain how did you do PCA analysis